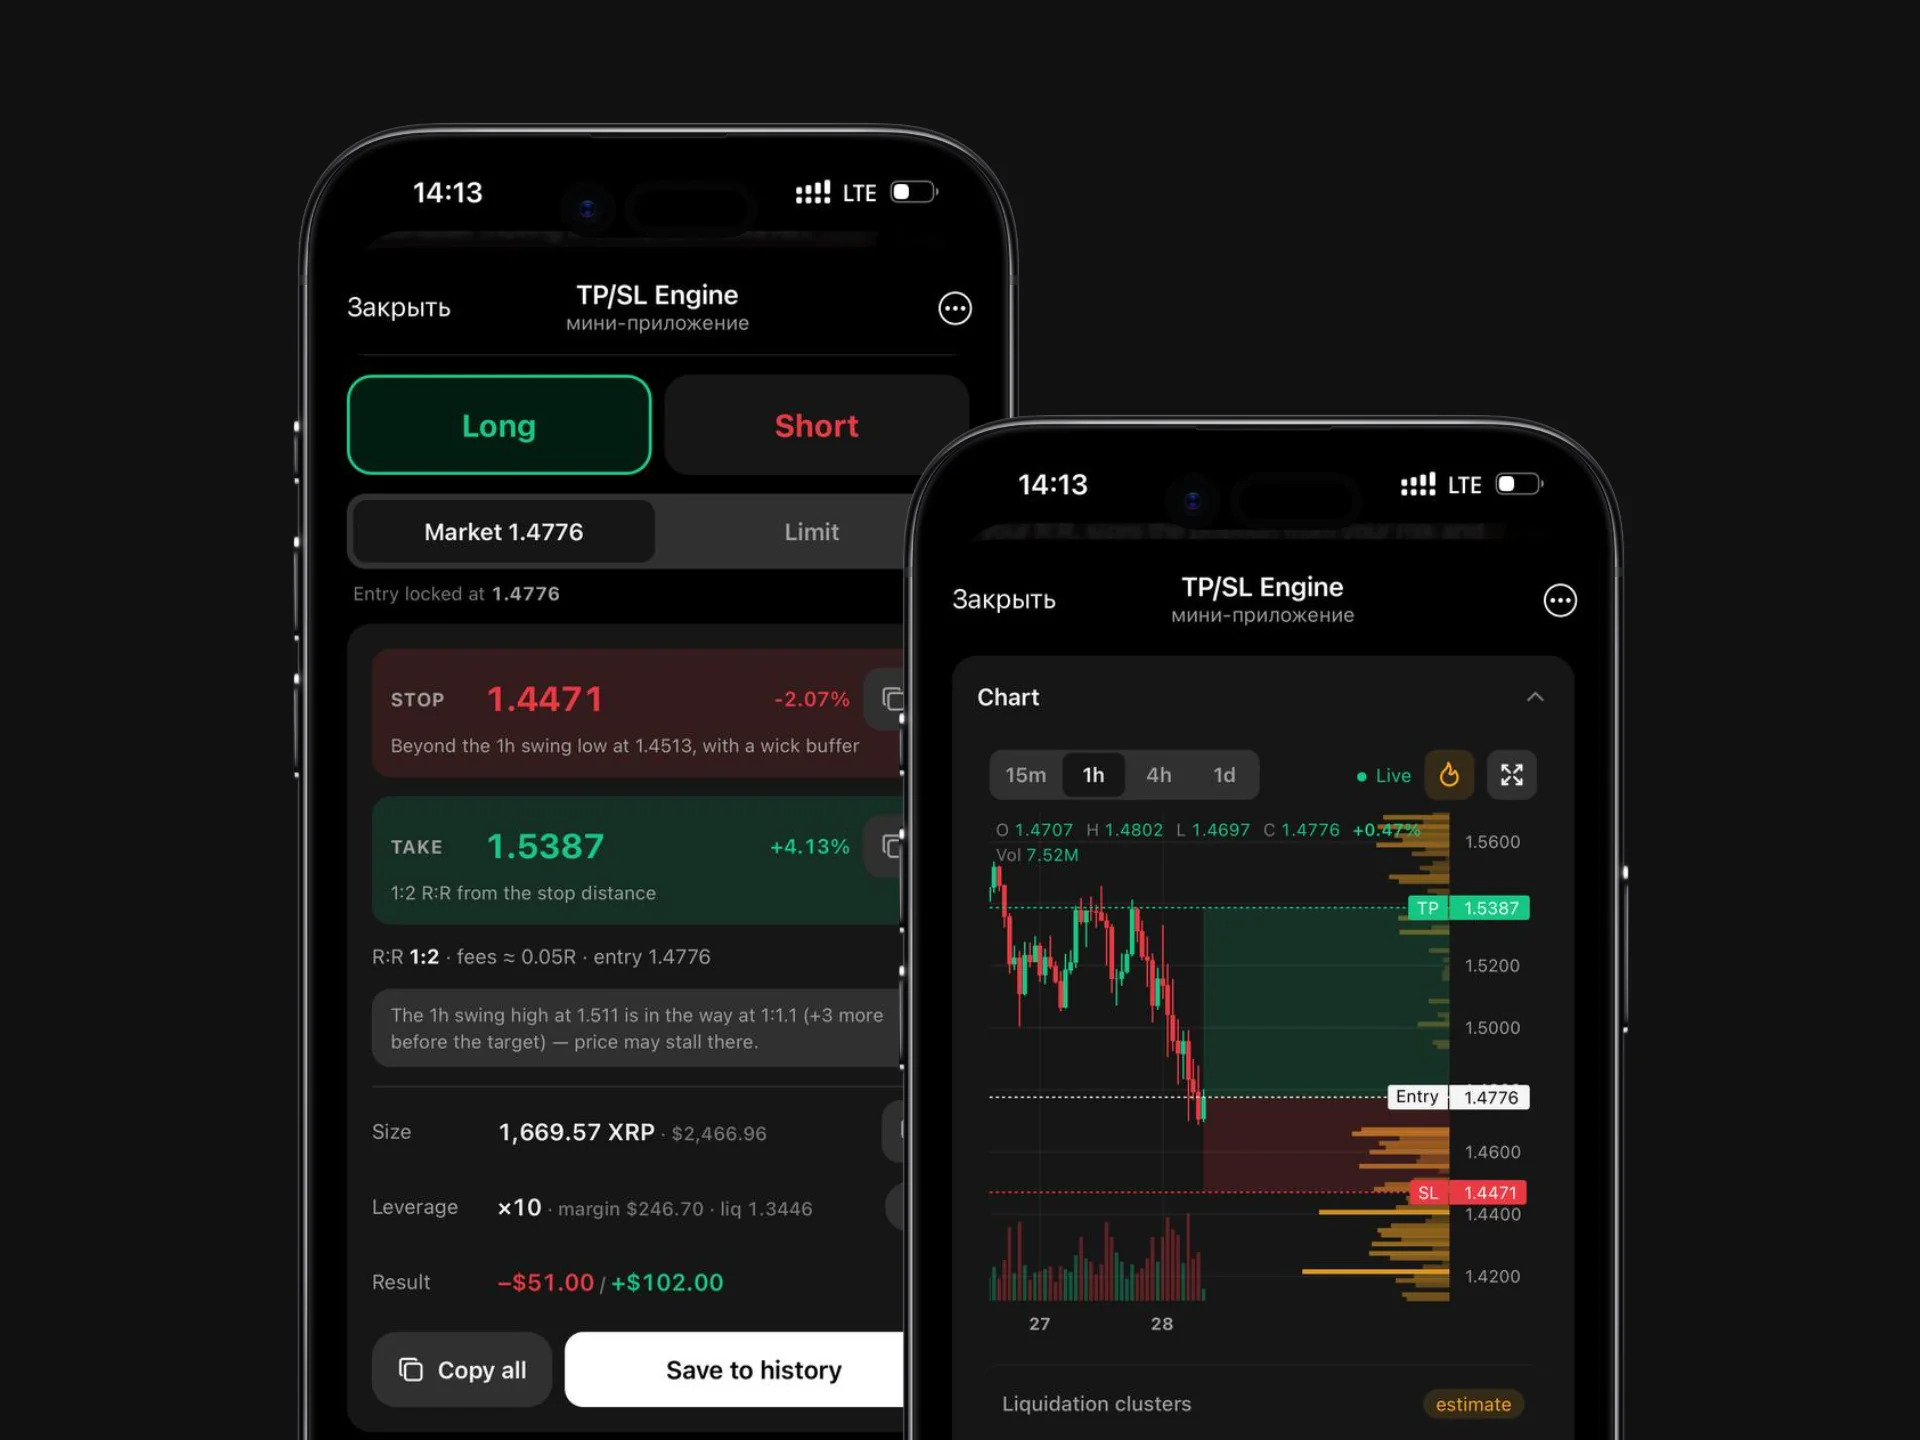
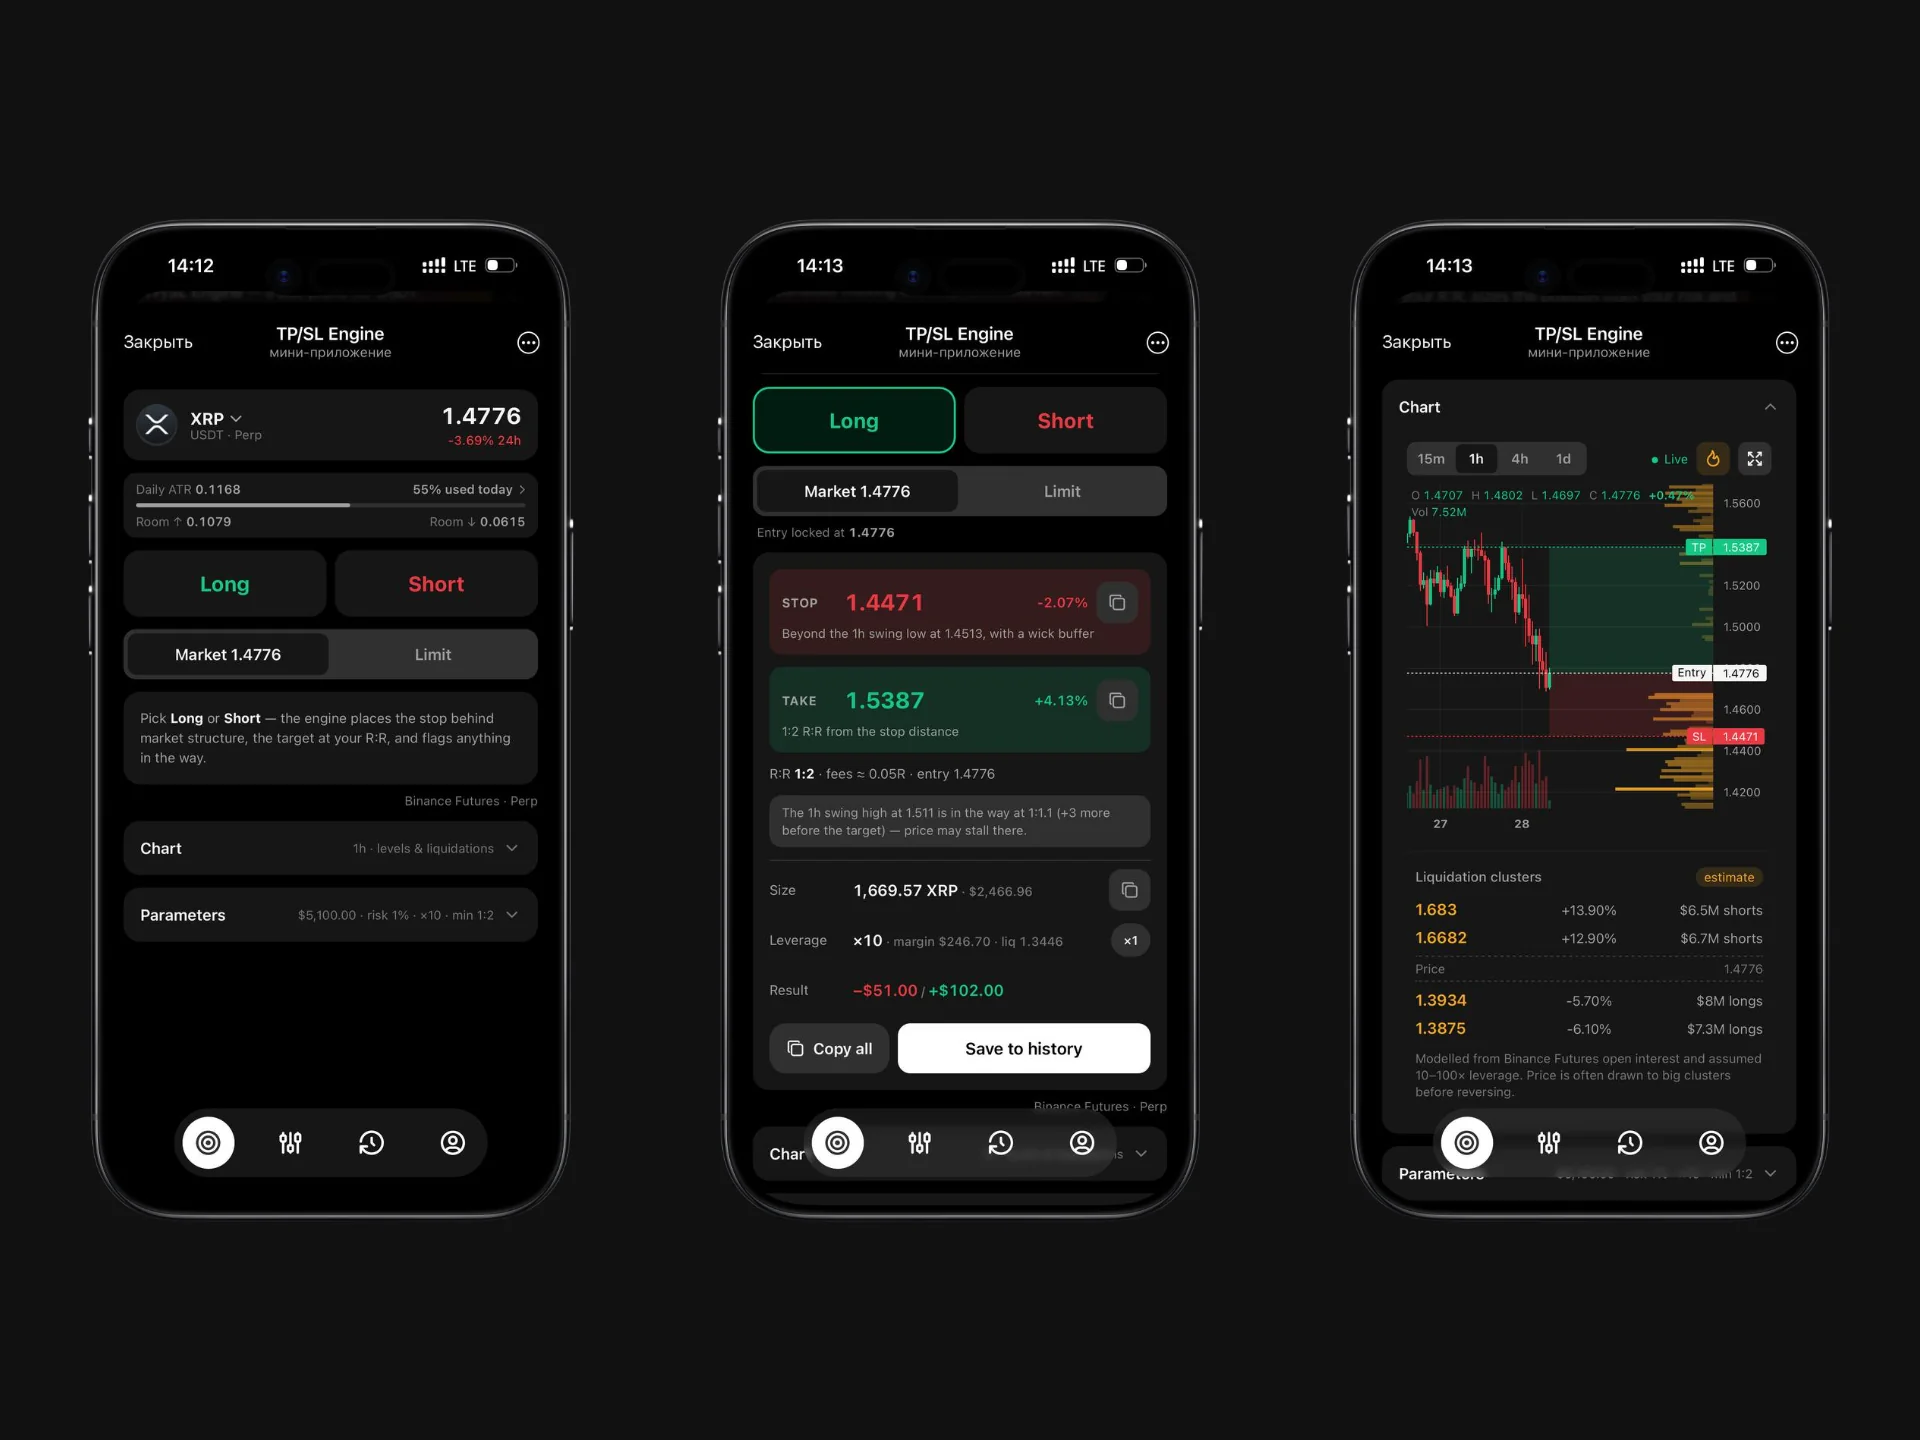
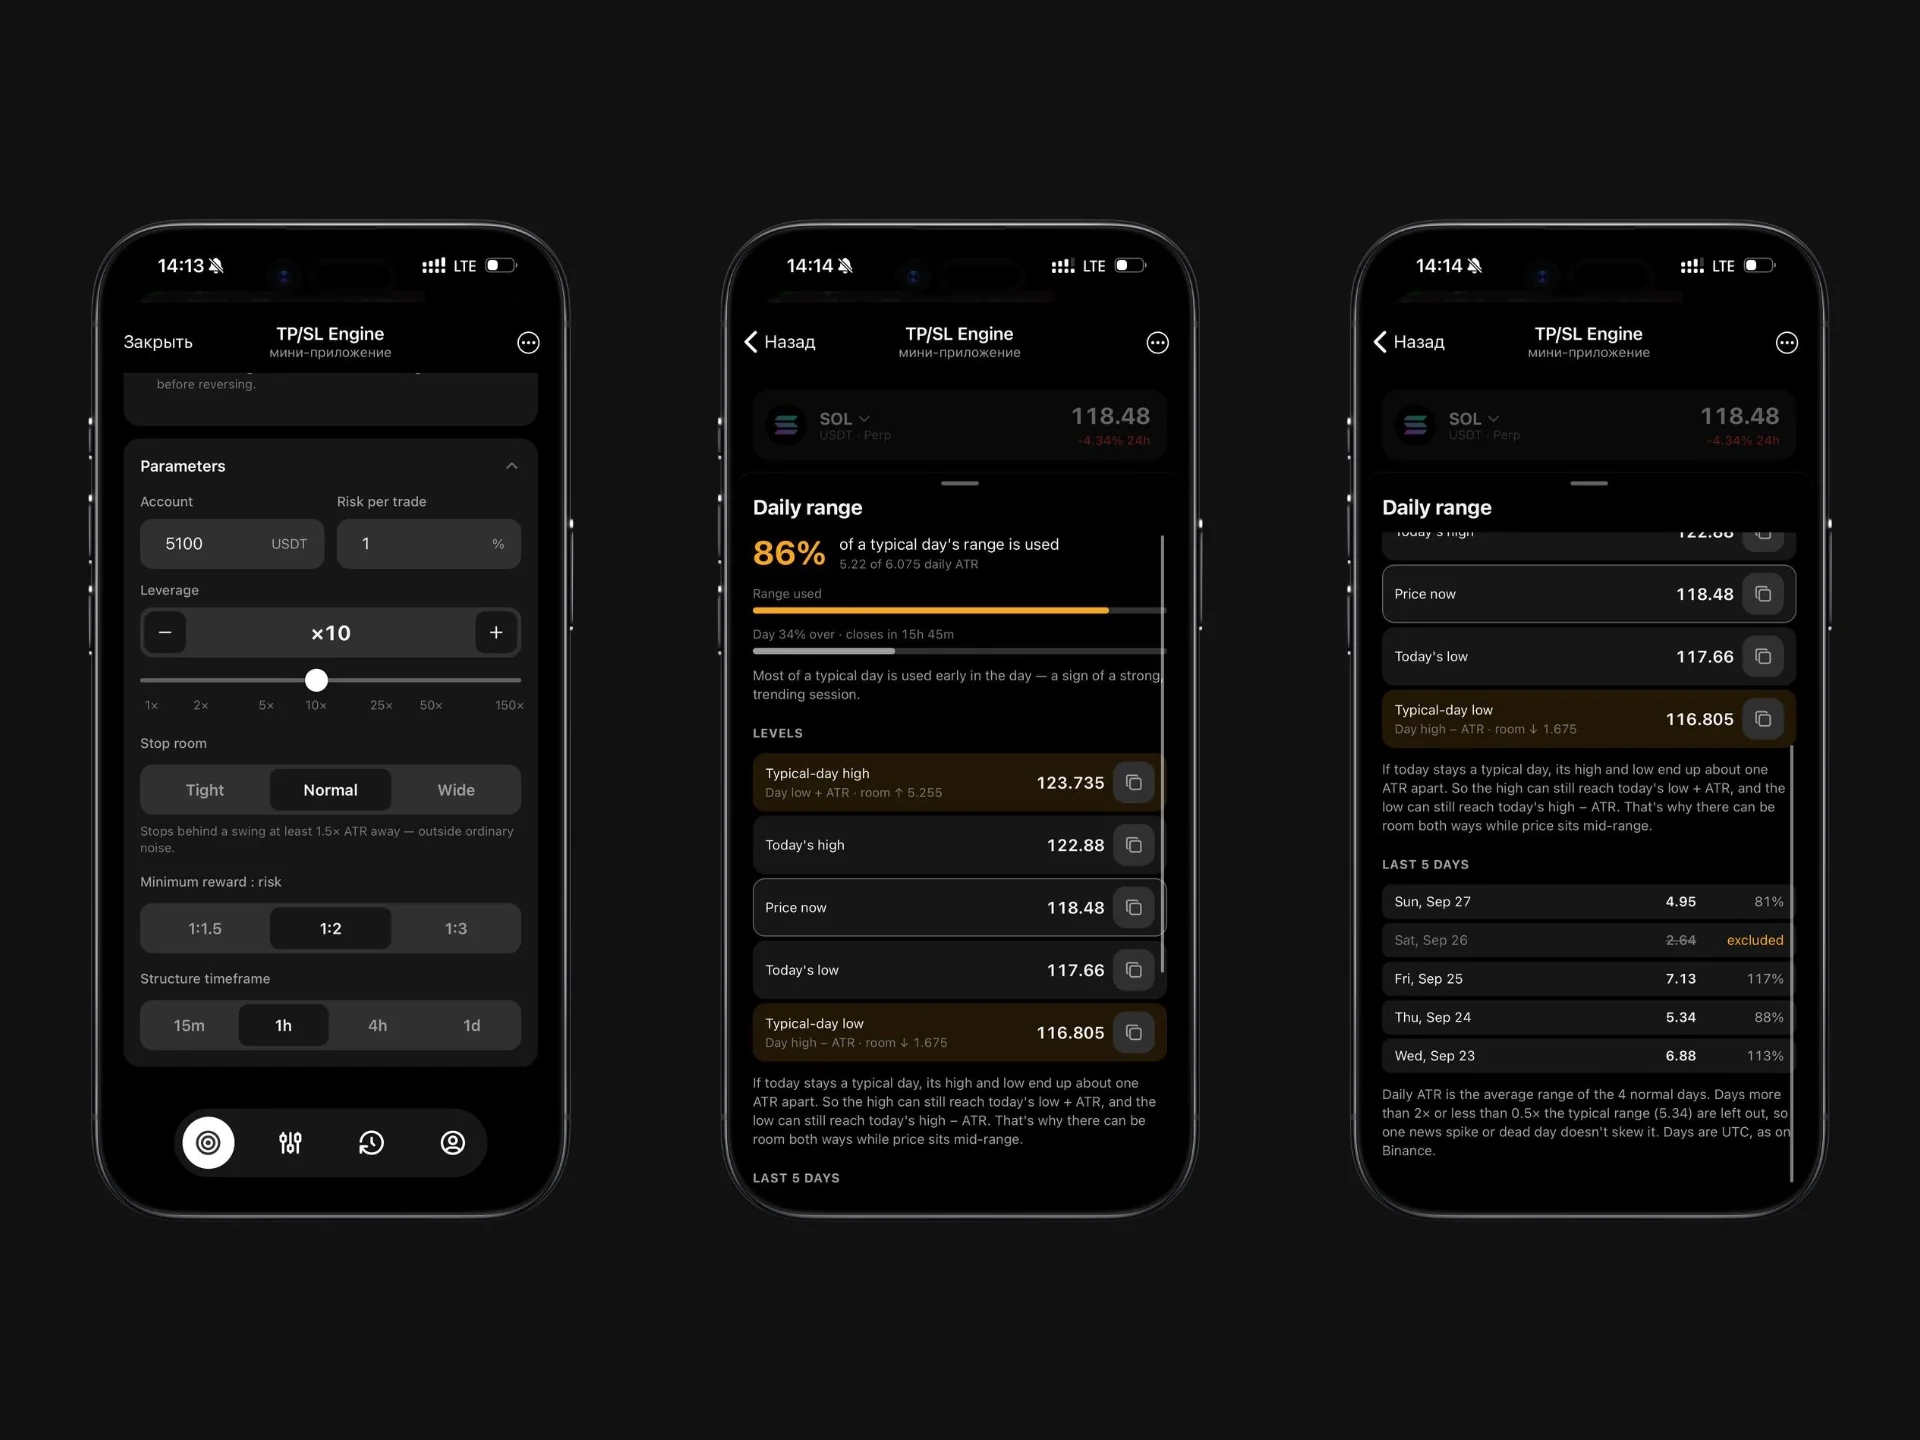
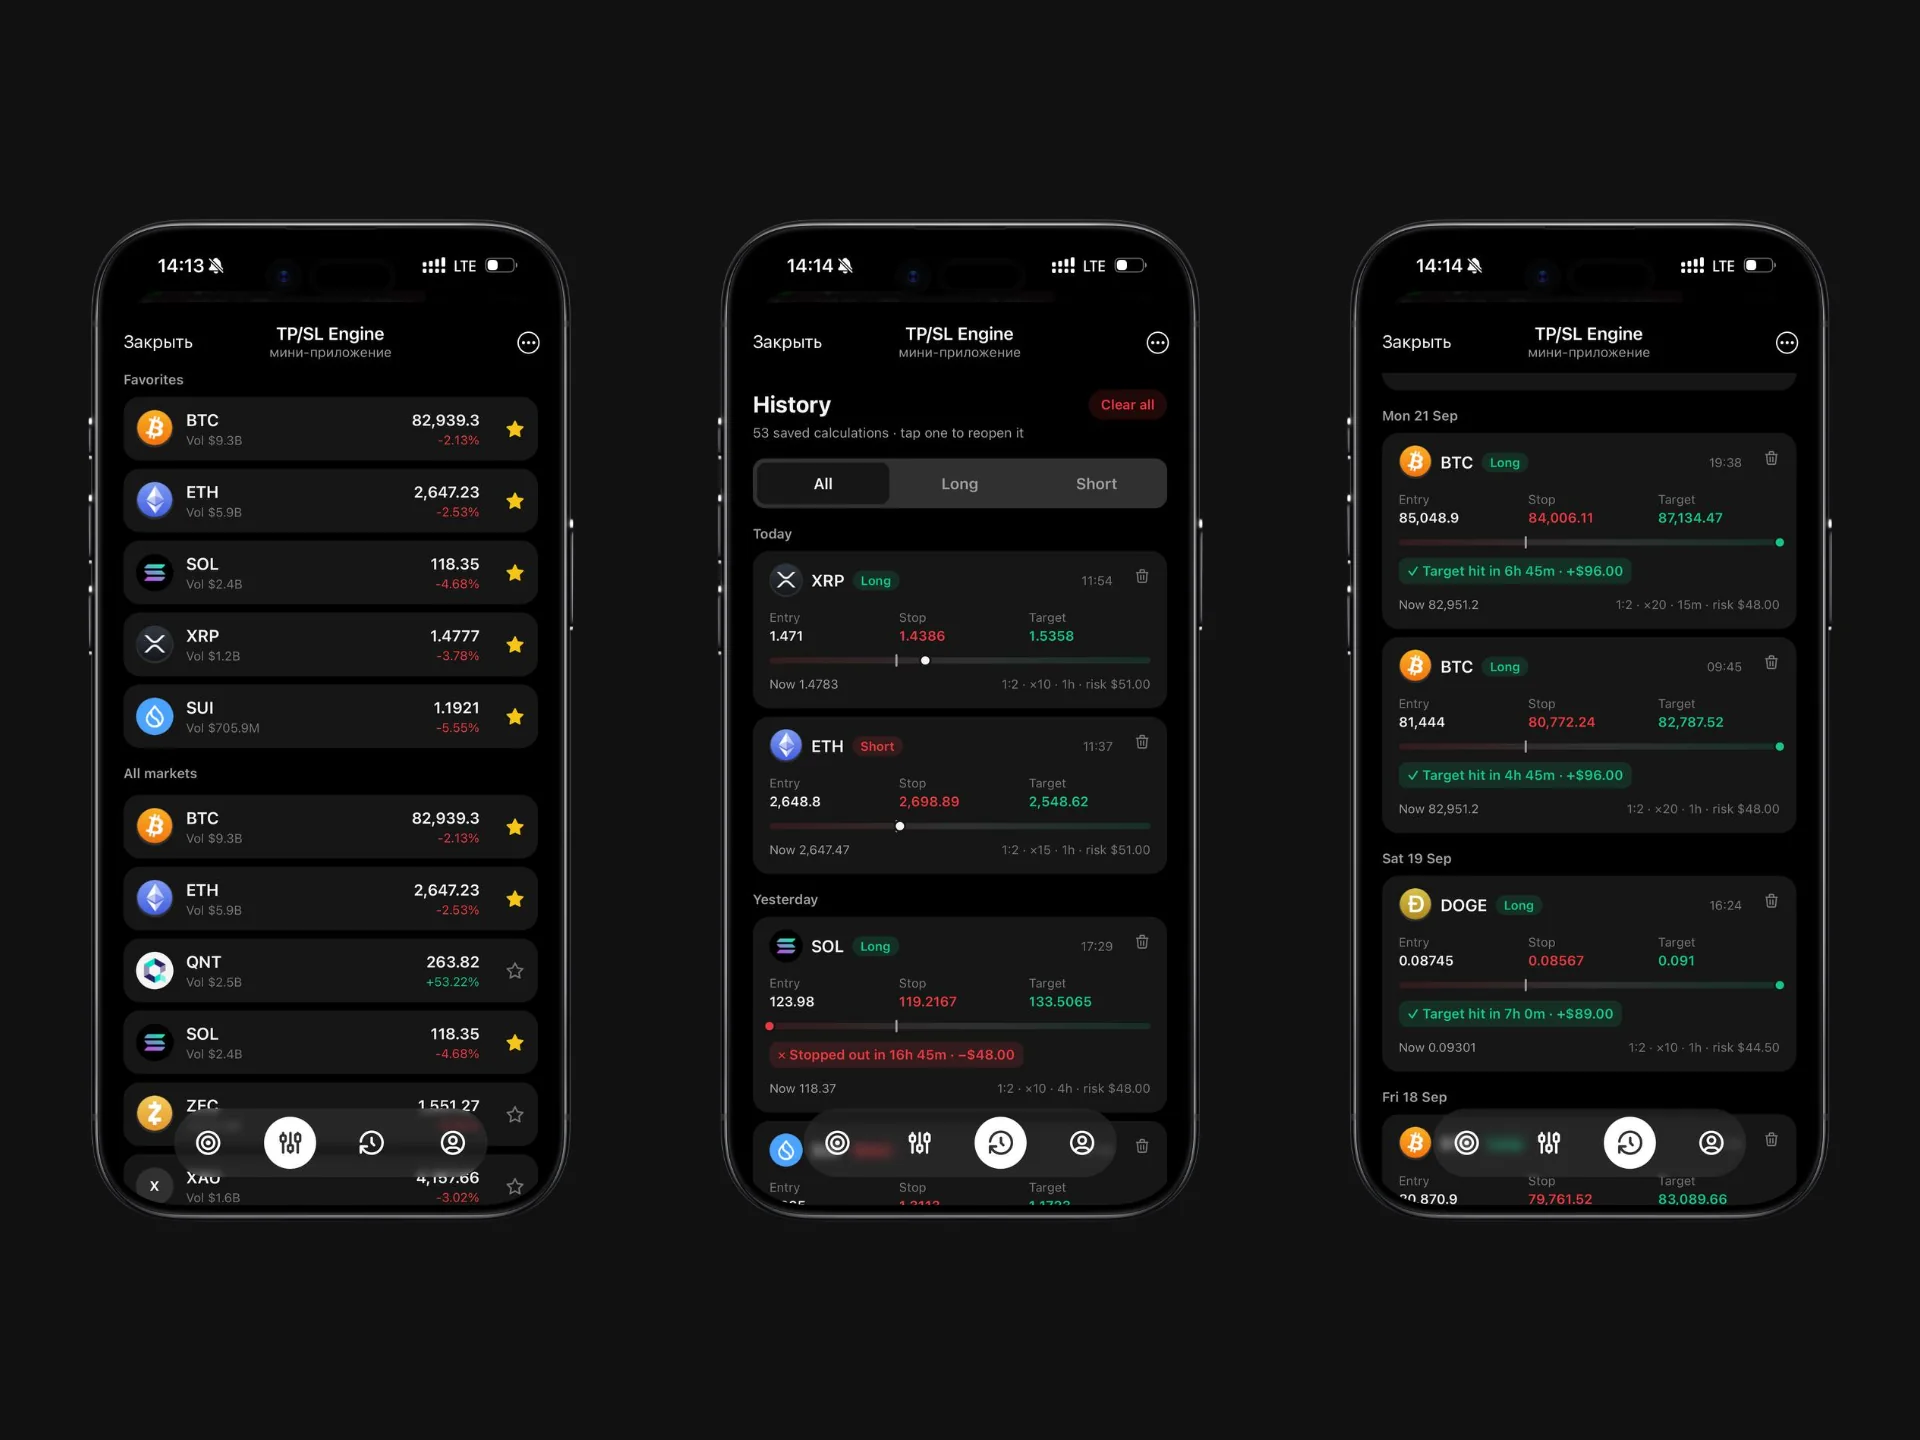
Drawdown Reduction & Parameter Tuning
Cut drawdown without curve fitting.
−44%Max drawdown, −24.7% → −13.9%
- Max drawdown
- −13.9%from −24.7%
- Profit factor
- 1.87from 1.31
- Net profit
- +71.6%from +38.2%
- Win rate
- 51.8%from 46.3%
Where it broke
A 4h trend follower: breakout entries, an ATR-based stop, a fixed 3R target. On paper it made money. In practice every sideways stretch handed back months of gains, and a 25% drawdown in mid-2024 nearly ended it.
The stress test showed the losses weren't random. 71% of the drawdown came from entries taken while the daily trend was flat, and stops at 1.8 ATR were being hit by ordinary noise before trades had room to work.
The goal was agreed up front: cut the drawdown without inventing a new strategy. Every change had to be explained by the market, not by the backtest.
Changelog
- adddaily trend filter (EMA 50 slope)trades −31% · DD −6.8%
- tuneATR stop 1.8 → 2.2stopped out, then right: −42%
- tune3R target → 2.5 ATR trailing exitavg. winner held +19%
- fixenter on bar close, not intrabarlook-ahead removed from backtest
- removeRSI confirmationno measurable edge · one less parameter
What got worse
The average win dropped
+2.14% → +2.02%. The trailing exit gives some profit back on reversals. That's the price of holding the trends that pay for everything else.
A third fewer trades
412 → 287 over the period. Long flat months with nothing to do are now normal. That's the filter working, not the strategy breaking.
Walk-forward
Tuned on one stretch of history, then run untouched on the next. Six out-of-sample windows:
| 2023 H1 | +9.4% | ✓ passed |
|---|---|---|
| 2023 H2 | +6.1% | ✓ passed |
| 2024 H1 | −3.2% · within DD limit | ✓ passed |
| 2024 H2 | +14.8% | ✓ passed |
| 2025 H1 | +11.2% | ✓ passed |
| 2025 H2 | +7.9% | ✓ passed |
Client review
The stress test showed exactly where our strategy was fragile. We cut drawdown without curve fitting, and the changelog made every change easy to trust.
 Maya OrtizSystematic Trader